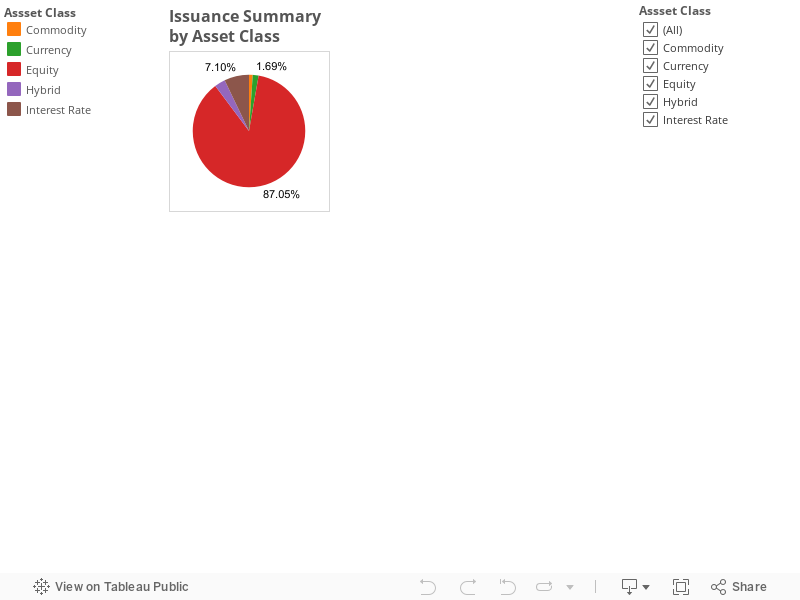
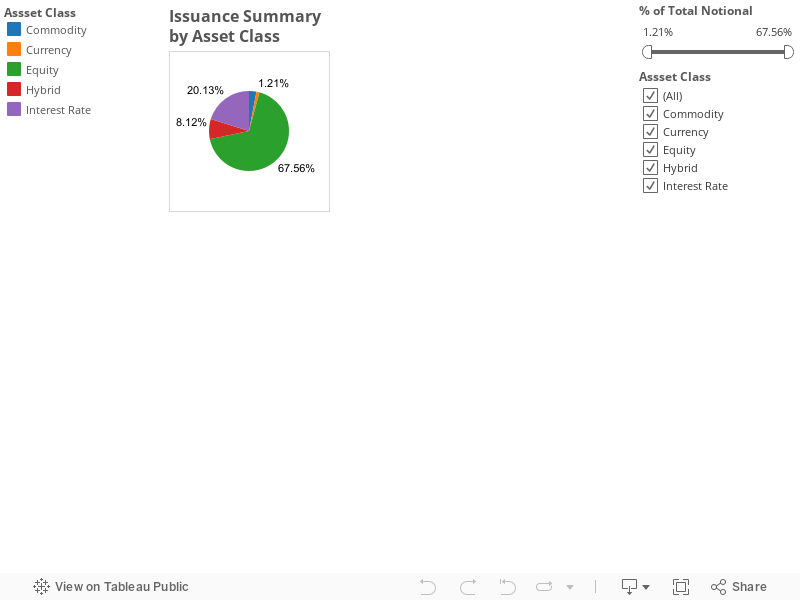
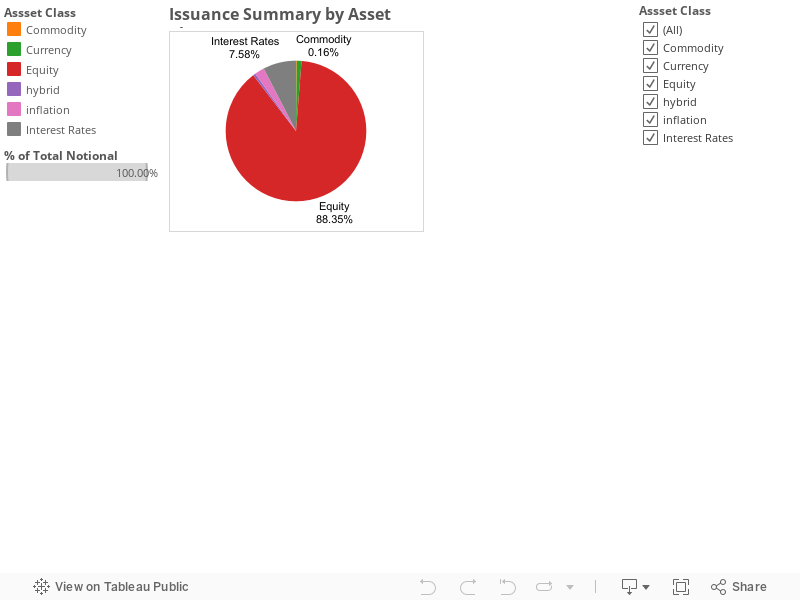
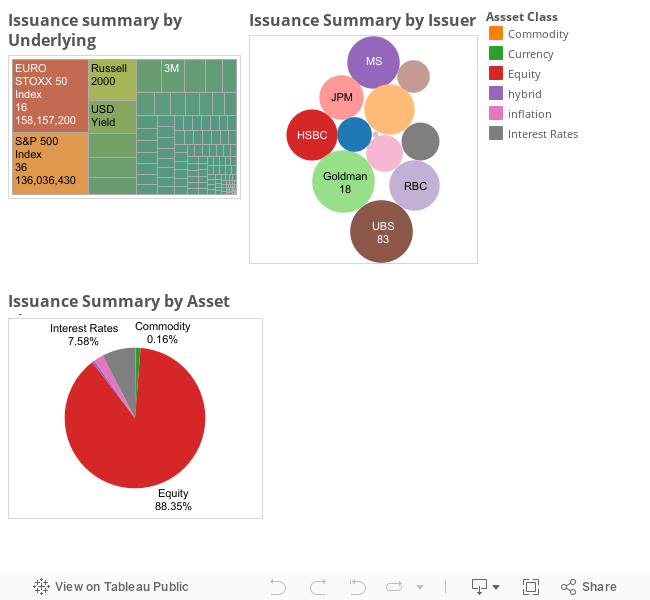
During the week of August 26-30, 2013 structured note issuance has been 870 MM across various issuers and asset classes. Most of the issuance (88%) is driven by Equity linked notes and 7.58 % of the issuance is driven by Interest rate linked products. For Details of the distribution refer to the chart below. Not surprisingly majority of the structured note issuance is linked to Equity linked.
 Interactive Issuance analysis
You can click individual asset classes to see how the underlying issuance has happened within each asset type by underlying and Issuer.
Interactive Issuance analysis
You can click individual asset classes to see how the underlying issuance has happened within each asset type by underlying and Issuer.
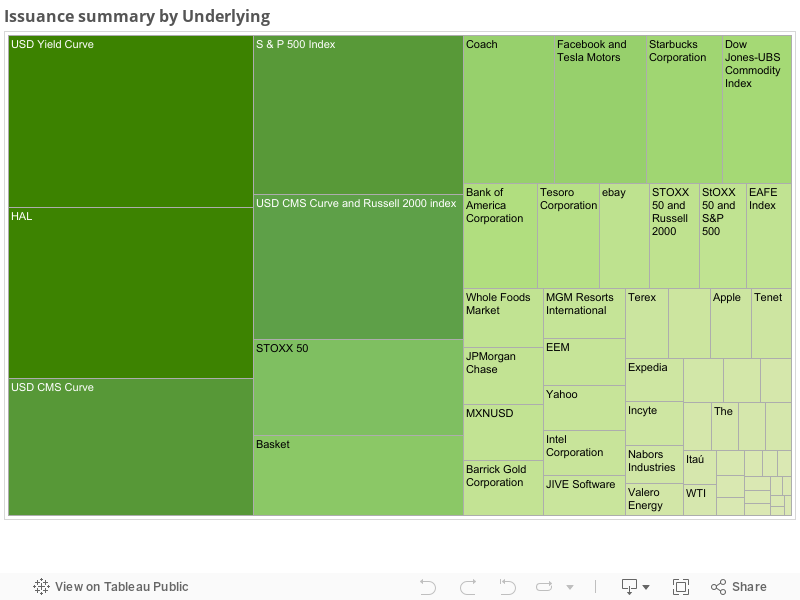
 Underlying analysis
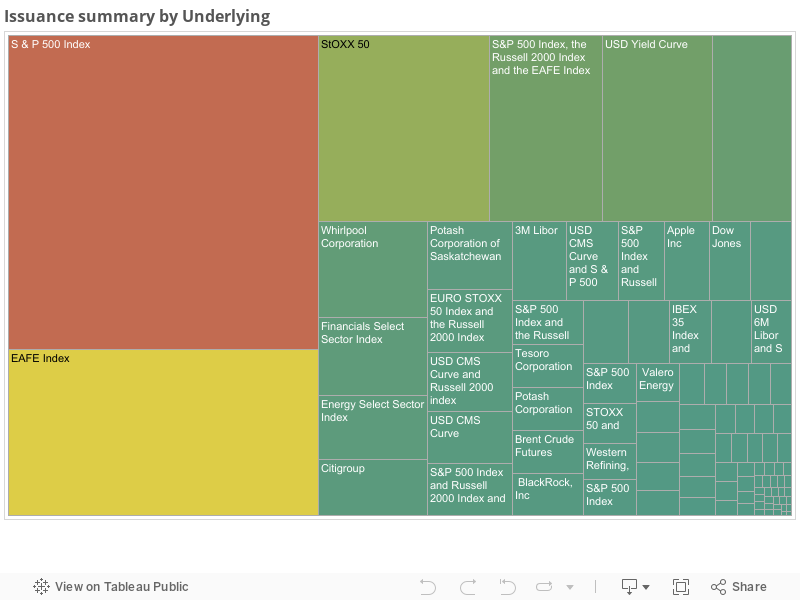
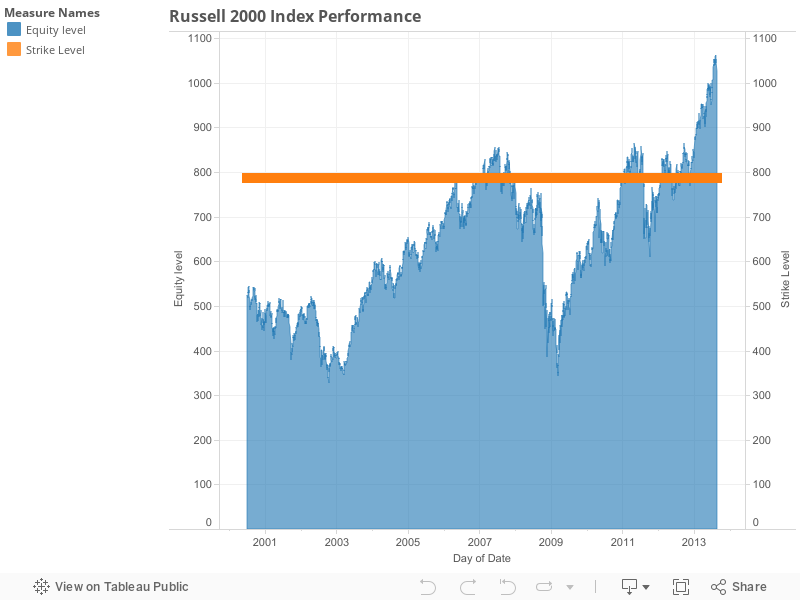
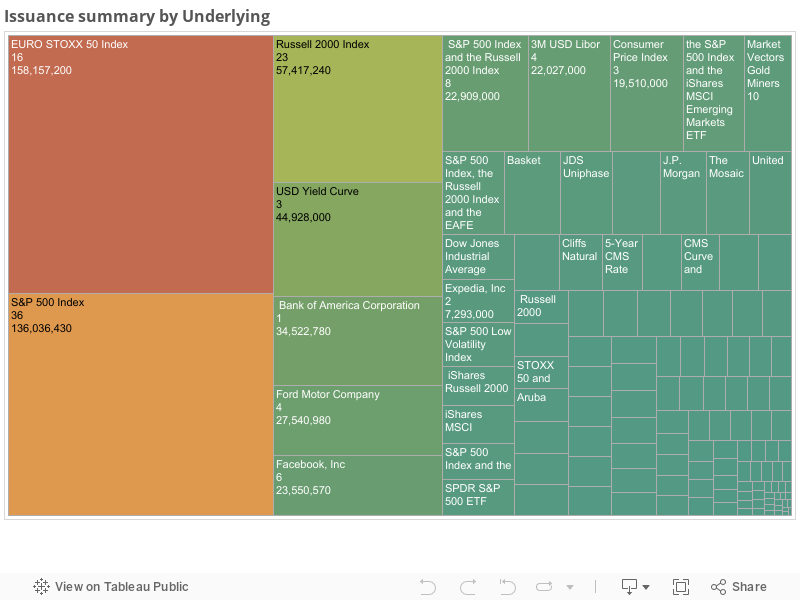 Issuers have been designing equity linked notes with variety of indices. Issuance related S&P 500, Russell index and STOXX 50 Index have been close 50% of entire issuance. This shows how recent run up in the equity market has generated interest with in the market players. These 3 indices capture market performance in US, Developed markets outside North America and Euro region respectively. Bullish performance in developed equity markets contrasts the under performance in emerging markets that are plagued by falling currencies ( Brazil and India) and political turmoil (Egypt).
Notably HSBC issued a large note on STOXX 50 index to the investors. These notes belong to class of leveraged notes. They command twice the market performance without any cap. On the downside this note is protected loses up to 50% fall in the index. Beyond 50% fall in the index investors will participate in 1 to 1 downside. There is a possibility of losing 100% of the principal. But If investors portfolios have captured market performance and think market performance would not be in single digits they can juice twice the returns with some protection. Definitely a good deal to think of!. There are other notes that were designed with S&P 500 and EURO STOXX 50 index. There are some interesting notes that are providing good return on the investment. Refer to the chart below for issuance of other underlyings.
Issuers have been designing equity linked notes with variety of indices. Issuance related S&P 500, Russell index and STOXX 50 Index have been close 50% of entire issuance. This shows how recent run up in the equity market has generated interest with in the market players. These 3 indices capture market performance in US, Developed markets outside North America and Euro region respectively. Bullish performance in developed equity markets contrasts the under performance in emerging markets that are plagued by falling currencies ( Brazil and India) and political turmoil (Egypt).
Notably HSBC issued a large note on STOXX 50 index to the investors. These notes belong to class of leveraged notes. They command twice the market performance without any cap. On the downside this note is protected loses up to 50% fall in the index. Beyond 50% fall in the index investors will participate in 1 to 1 downside. There is a possibility of losing 100% of the principal. But If investors portfolios have captured market performance and think market performance would not be in single digits they can juice twice the returns with some protection. Definitely a good deal to think of!. There are other notes that were designed with S&P 500 and EURO STOXX 50 index. There are some interesting notes that are providing good return on the investment. Refer to the chart below for issuance of other underlyings.
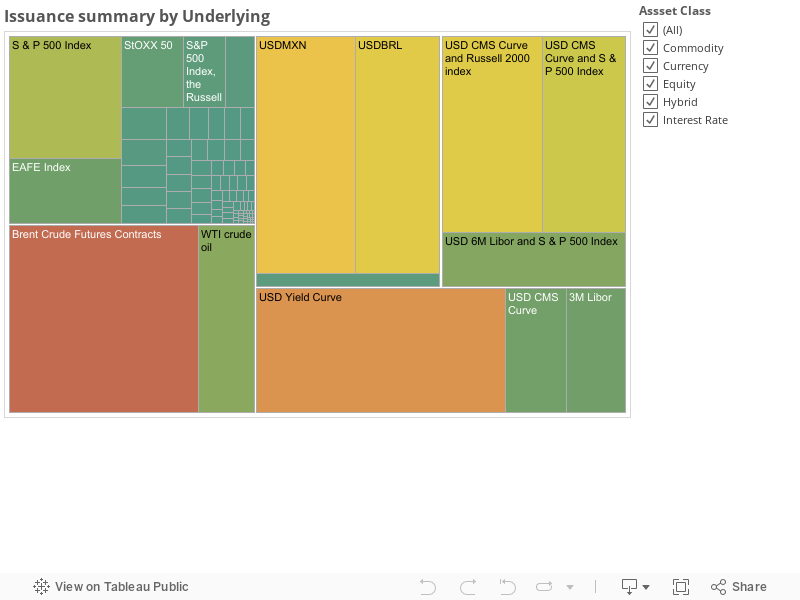
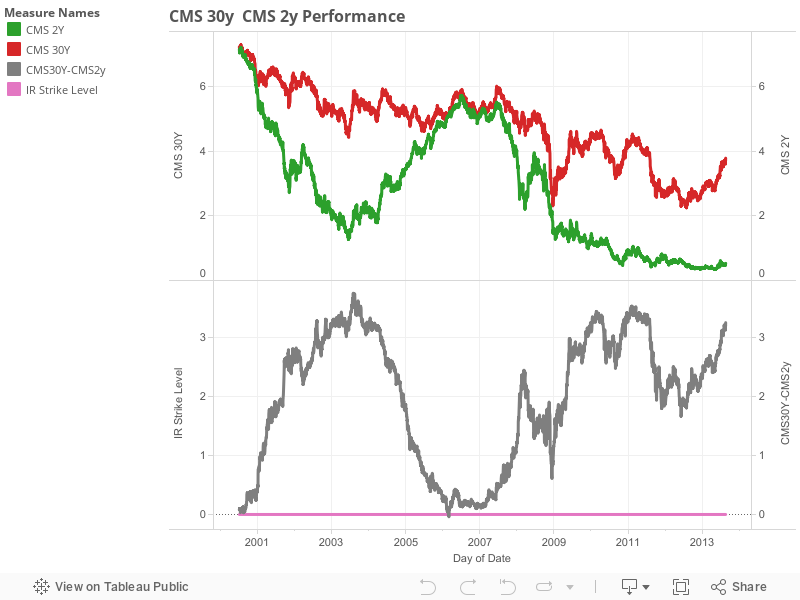
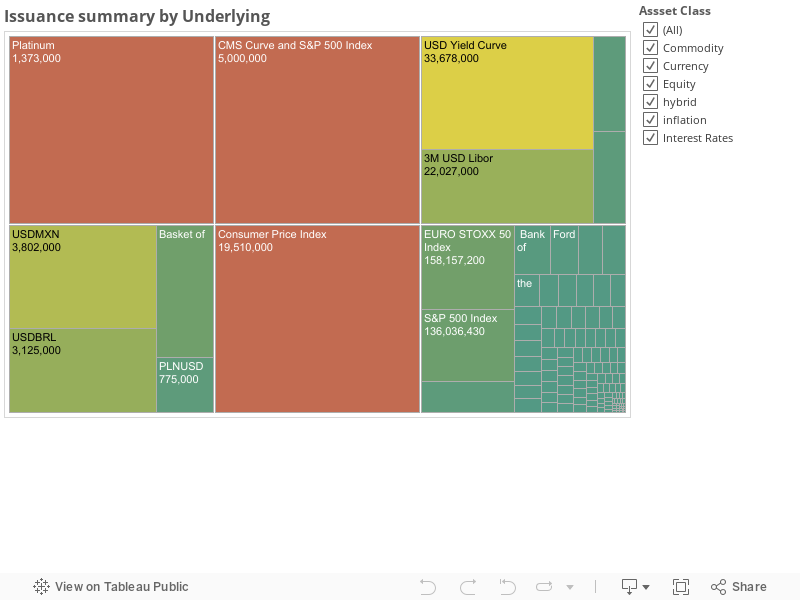 Interestingly With in Inflation asset class some action is happening. There has been a surge in issuance of products linked US CPI (consumer price index). For instance, Goldman has issued a note whose coupon tracks the performance of USD CPI ( Non-Seasonally Adjusted U.S. City Average All Items Consumer Price Index for All Urban Consumers). These notes pay a Coupon of 4 % per year interest in the first year. After that they pay Inflation rate + 140 bps spread capped at 7.5 % annum and floored at 0%.For investors who have allocation in their bond component to attain better returns this note is a good deal. This Note is principal protected.
There has been some issuance activity in Commodity and Currency segments of the markets. Currency asset class issuance have been tied to USDMXN, USDBRL and USDPLN currencies. These notes provide investors good returns as long as currencies settles does not depreciate more than 20%. Recently BRL currency has seen drop in its currency. This has prompted country central bank to execute swaps to protect from further drop in currency value. Investors can at least get a piece of this action.
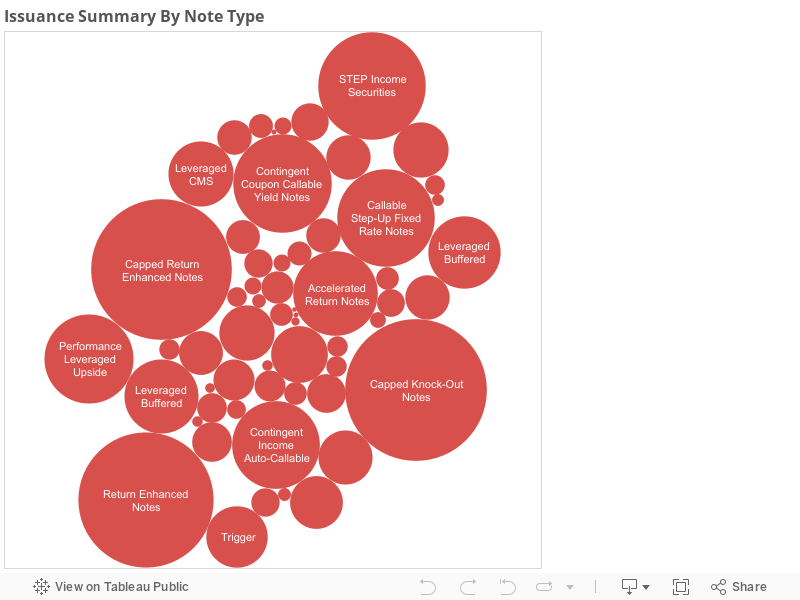
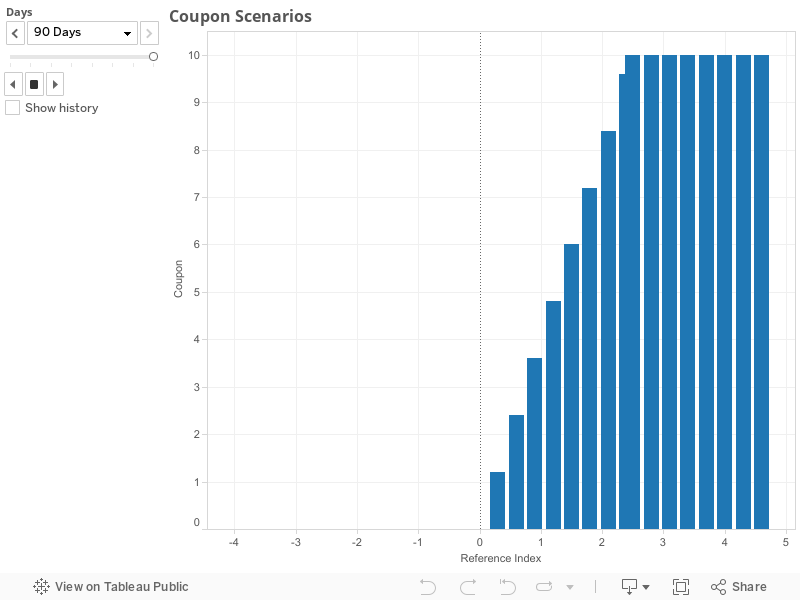
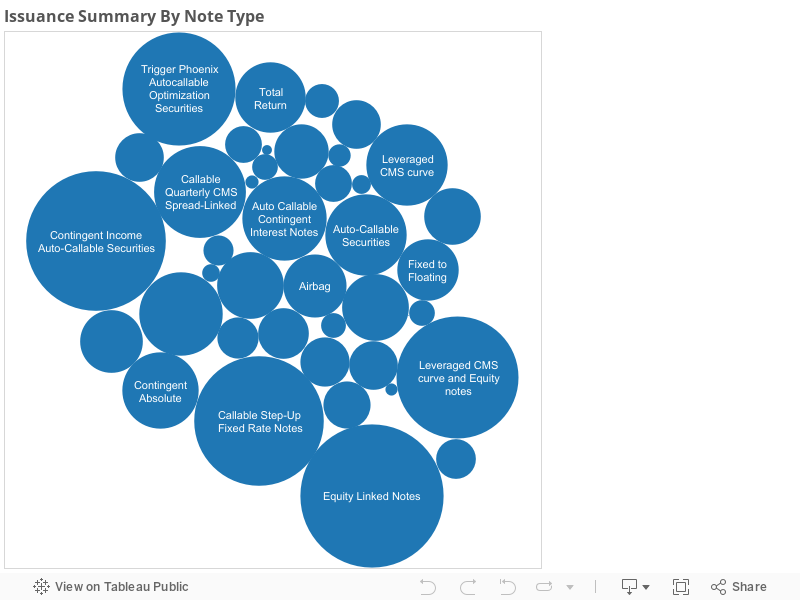
Size of the note types will tell us an indication of what type structures are popular among the investors and where money is flowing. Below chart shows this theme
Interestingly With in Inflation asset class some action is happening. There has been a surge in issuance of products linked US CPI (consumer price index). For instance, Goldman has issued a note whose coupon tracks the performance of USD CPI ( Non-Seasonally Adjusted U.S. City Average All Items Consumer Price Index for All Urban Consumers). These notes pay a Coupon of 4 % per year interest in the first year. After that they pay Inflation rate + 140 bps spread capped at 7.5 % annum and floored at 0%.For investors who have allocation in their bond component to attain better returns this note is a good deal. This Note is principal protected.
There has been some issuance activity in Commodity and Currency segments of the markets. Currency asset class issuance have been tied to USDMXN, USDBRL and USDPLN currencies. These notes provide investors good returns as long as currencies settles does not depreciate more than 20%. Recently BRL currency has seen drop in its currency. This has prompted country central bank to execute swaps to protect from further drop in currency value. Investors can at least get a piece of this action.
Size of the note types will tell us an indication of what type structures are popular among the investors and where money is flowing. Below chart shows this theme
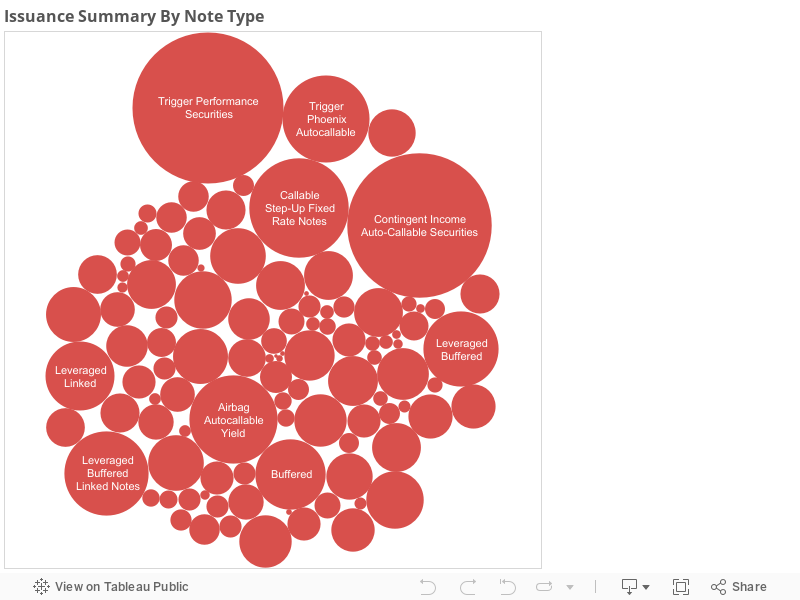 Popular notes have been Trigger Performance Notes, Callable Step up notes and Contingent Income Auto calleble notes. Two notes are equity index related notes designed to capture the leveraged performance in the equity markets.This kind of activity could be due to surge in demand from investors to capture market gains as they view markets will not be posting double digit returns. Third note type is Callable step up notes designed to motivate investors to capture above market yields in low yield environment.
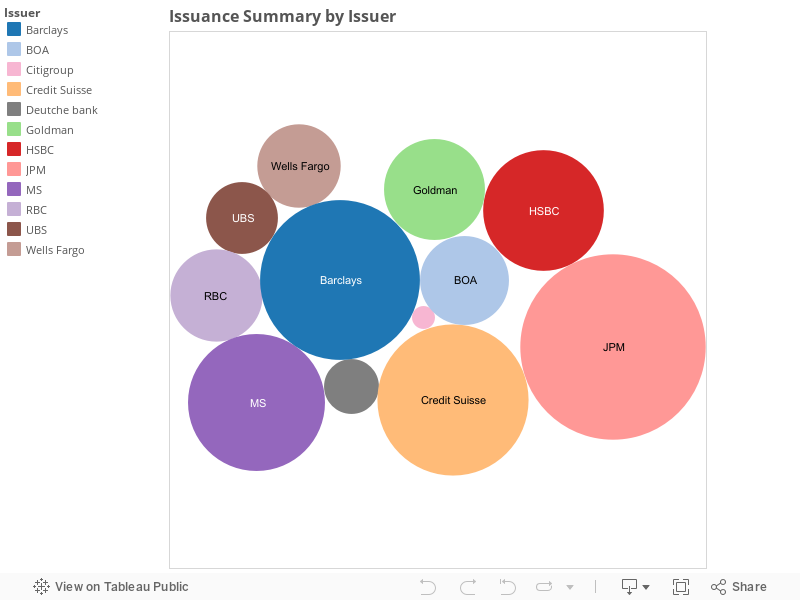
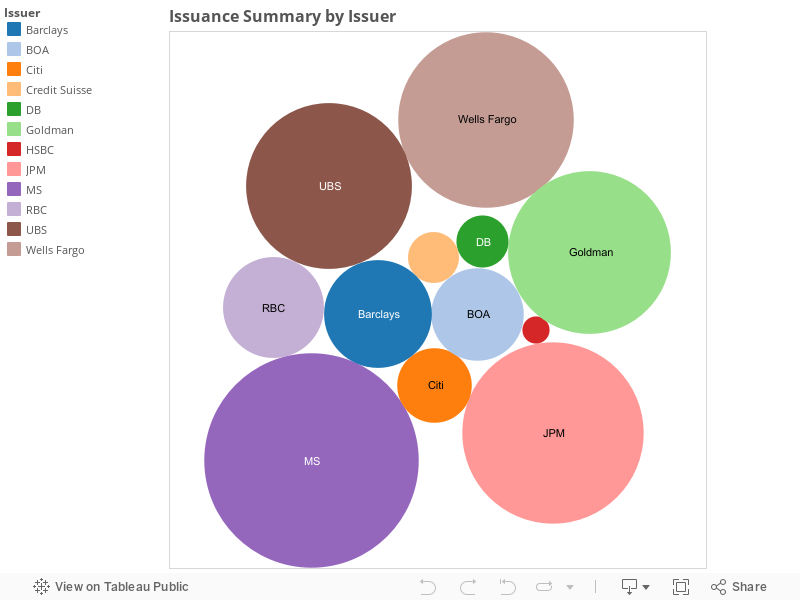
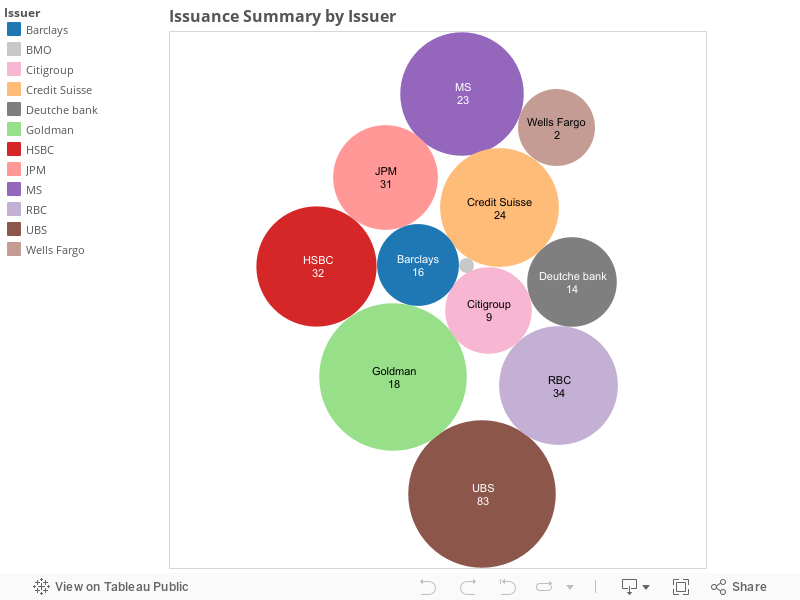
Now moving on to issuers side and understanding their market penetration or competitor analysis provides some interesting insights.
This week UBS with its large issuances of Equity linked notes captured 15% of the issuance volume. Goldman, HSBC and RBC captured market share near 10s.
Popular notes have been Trigger Performance Notes, Callable Step up notes and Contingent Income Auto calleble notes. Two notes are equity index related notes designed to capture the leveraged performance in the equity markets.This kind of activity could be due to surge in demand from investors to capture market gains as they view markets will not be posting double digit returns. Third note type is Callable step up notes designed to motivate investors to capture above market yields in low yield environment.
Now moving on to issuers side and understanding their market penetration or competitor analysis provides some interesting insights.
This week UBS with its large issuances of Equity linked notes captured 15% of the issuance volume. Goldman, HSBC and RBC captured market share near 10s.
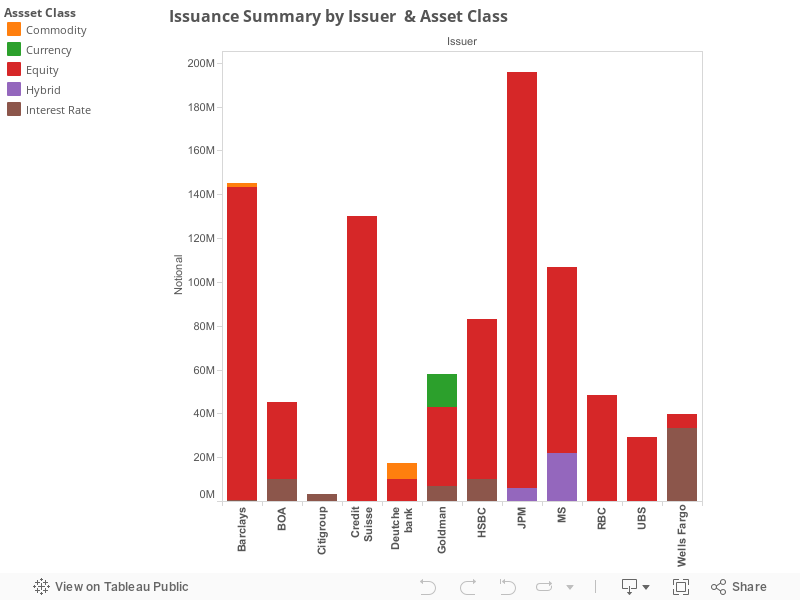
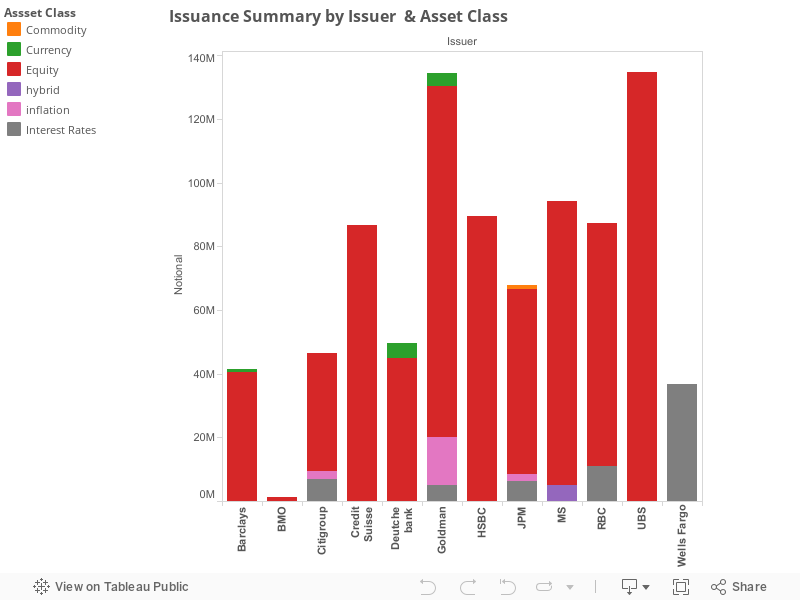
 Market penetration is driven by the issuer depth in each of the asset classes. Every issuer has presence in Equity linked issuance. Goldman is only issuer to produce Currency related issuance. Morgan Stanley and JPM are active players in the Hybrid related issuance.
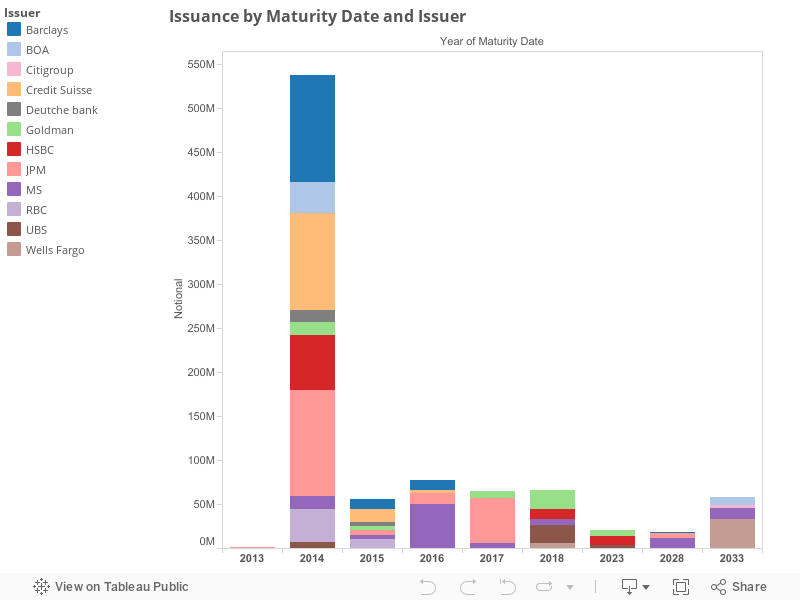
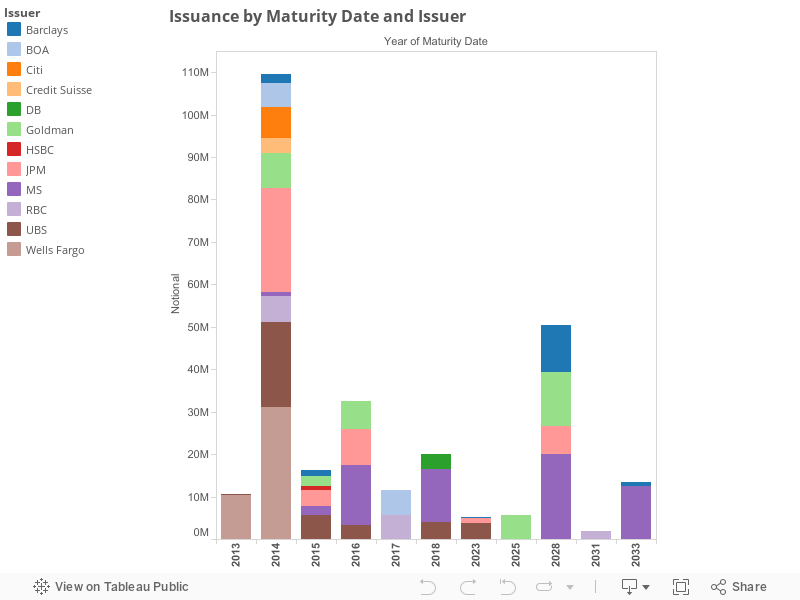
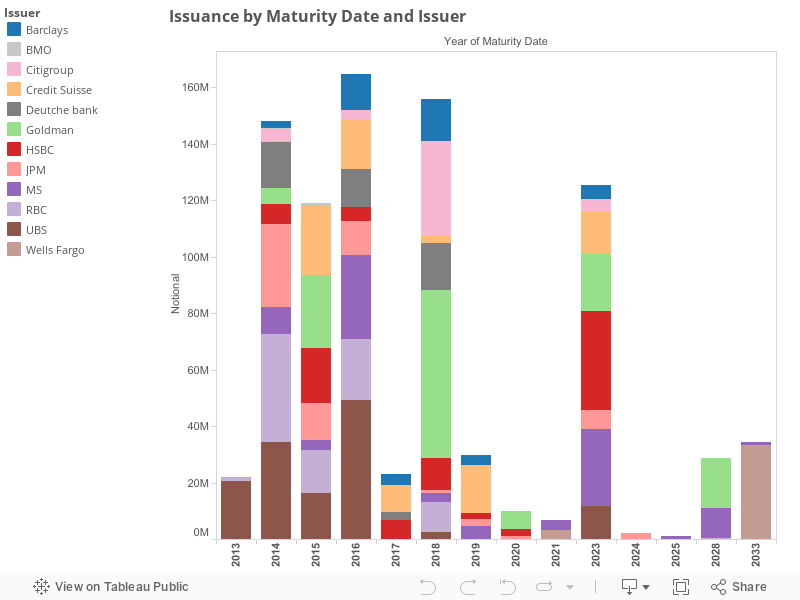
 Maturity profile of the issuance by issuer provides where volumes are anchored. Interestingly most of the volume issued this week matures between 2014 and 2018. This can be attributed to two facts. Issuers are stretching the maturity of the note to come up with better coupons.
 For additional details please refer to the Issuance summary table.